
In a world drowning in data, clarity isn’t just an advantage—it’s essential. Marketers juggle dozens of challenges, from customer acquisition to budget constraints. Yet, amid these struggles, one truth stands out: your data has a story to tell, but only if you can simplify it.
Enter infographics and data visualization.
These tools are more than just eye candy. They’re the visual translations your audience craves, turning overwhelming charts and dense spreadsheets into narratives that inform, inspire, and drive action. Here’s why you should care and how to make it work for you.
Why Simplicity Wins
Let’s be honest—your customers and stakeholders don’t have time to dissect complex reports. They skim, scroll, and decide in seconds. If you can’t communicate your message quickly and effectively, it’s lost.
Infographics aren’t just about “making things pretty.” They’re about making data approachable. Think about it:
- Would you rather read a 20-page report on industry trends or glance at a sleek one-pager highlighting the key insights?
- Which is more memorable—a wall of text or a vivid visual that sparks curiosity?
When you simplify, you amplify.
The Science of Visual Storytelling
Humans are wired to process visuals faster than text. Neuroscience backs this up: we process images 60,000 times faster than words. A well-designed infographic taps into this cognitive shortcut, ensuring your message cuts through the noise.
Data visualization isn’t just decoration; it’s context. A bar graph can show growth, but a custom visualization tailored to your business narrative can show why that growth matters.
Practical Applications for Entrepreneurs
Infographics and data visualization aren’t just tools for tech giants or analysts—they’re powerful assets for small businesses looking to stand out. Here are three key ways to use them effectively:
1. Pitch Decks That Sell
- Why it matters: Investors and partners don’t have time to sift through excessive details—they need the big picture.
- How it works: Infographics turn your financials, market research, and projections into clear, compelling visuals that drive decisions.
2. Content Marketing That Converts
- Why it matters: Shareable content boosts brand visibility and engagement across blogs, emails, and social media.
- How it works: Infographics distill complex ideas into visually striking, digestible formats that inspire action.
3. Customer Education That Sticks
- Why it matters: Building trust means helping your customers understand the value of your product or service.
- How it works: Visuals simplify complicated processes or benefits, making your message memorable and relatable.
The How: Make It Work for You
A great infographic doesn’t just look good—it communicates effectively. Follow these three steps to create visuals that resonate:
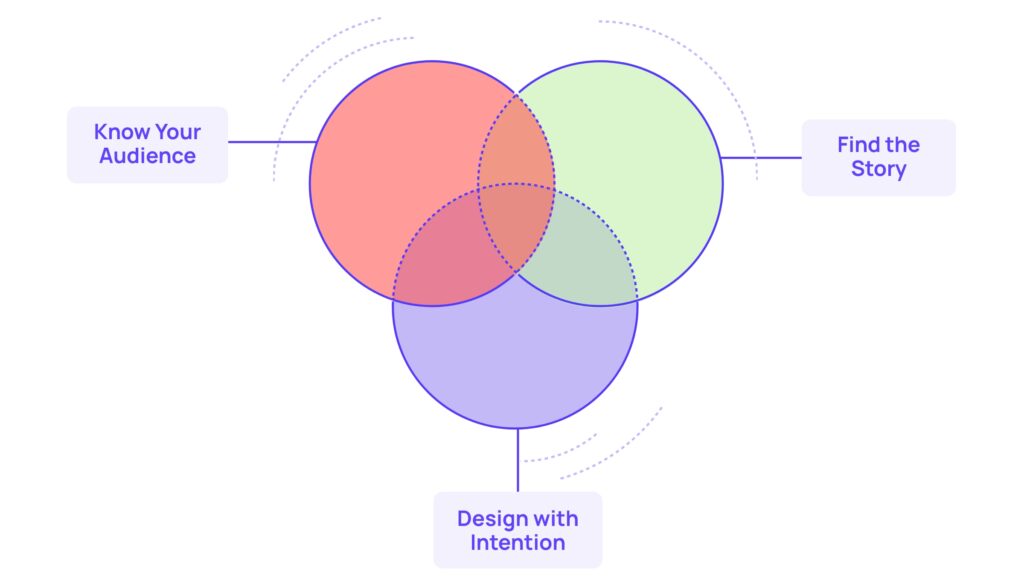
1. Know Your Audience
- Why it matters: A message that doesn’t connect with its audience is just noise.
- How to do it: Identify their pain points, interests, and preferred communication styles, then tailor your visuals accordingly.
2. Find the Story
- Why it matters: Data without context or narrative is hard to remember and even harder to act on.
- How to do it: Focus on the core insight you want to convey and weave it into a compelling visual story.
3. Design with Intention
- Why it matters: Poor design can confuse or alienate your audience, no matter how good the data is.
- How to do it: Use clean layouts, purposeful colors, and typography that enhances readability—or hire a professional if needed.

Your Secret Weapon
At The Grove Creative, we specialize in helping entrepreneurs and small to mid-sized businesses turn data into visual gold. From custom infographics to full-blown data dashboards, we craft visuals that don’t just inform—they transform.
Let’s simplify the complex. Because in the race for attention, clarity always wins.
What’s your next big idea? Let’s make it visual.
Simplicity isn’t a compromise—it’s a superpower. Use it wisely.